Although the international price of gold is rising, but before investing in gold, we must also observe the trend of gold in recent years.
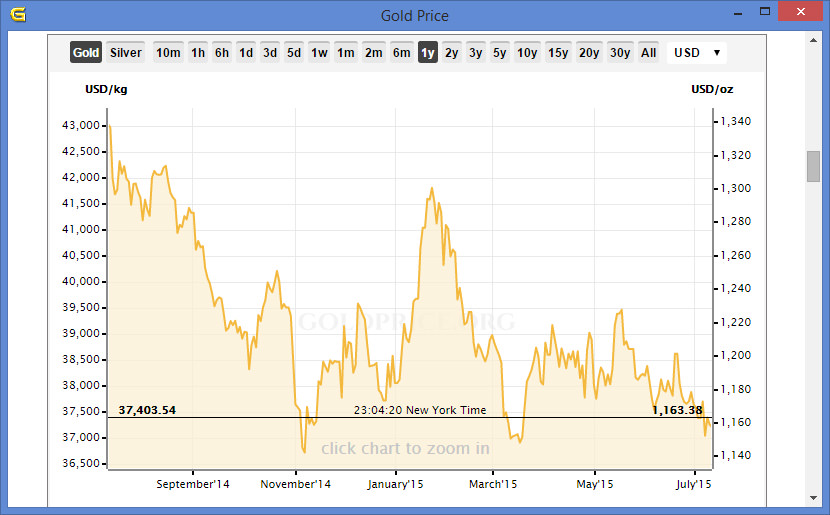
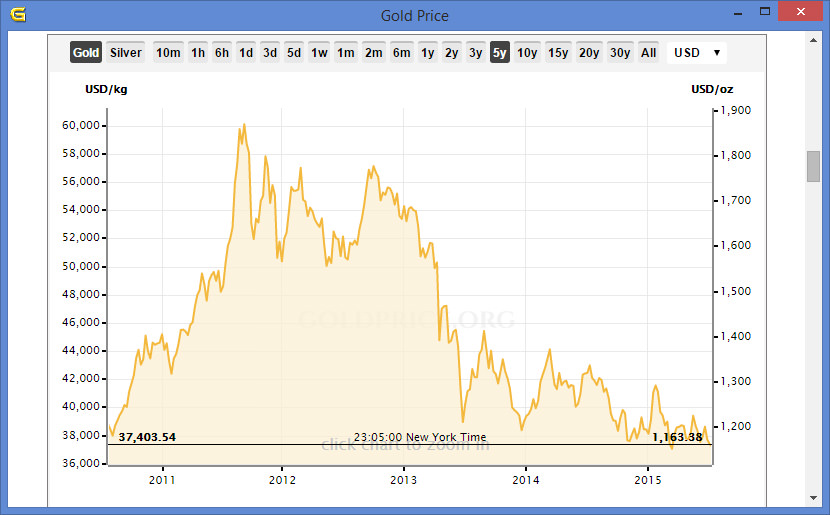
Here, I prepared the the gold price history chart for the past 1 year, five years and 20 years.
Gold Price 1 Year History Chart

Gold Price 5 Years History Chart

Gold Price 20 Years History Chart

Apart from the above chart, gold price fluctuations for the past 1 year. However, the gold price began to move towards the peak in the last 5-6 years.
From 1990 to 2005, the gold price basically has been hovering at USD 300 – 400 or so.
So, today’s gold price has reached its peak? Gold Investment can get good returns? Please think before act.
The post 20 Years Gold Price history chart appeared first on MisterLeaf.